Working Notes on Agent Systems/Brad Zhang

@teach_fireworks / X longform

One of the most annoying things about writing technical articles: drawing pictures. The...

One of the most annoying things about writing technical articles: drawing pictures. The structure that is very clear in my mind is always misaligned, the color is ugly, and the...

April 10, 2026 · 1 min read

One of the most annoying things about writing technical articles: drawing pictures. The...
Figure 1 / source image

One of the most annoying things about writing technical articles: drawing pictures.

The structure that is very clear in my mind is always misaligned, the color is ugly, and the export is blurry when I put it on.

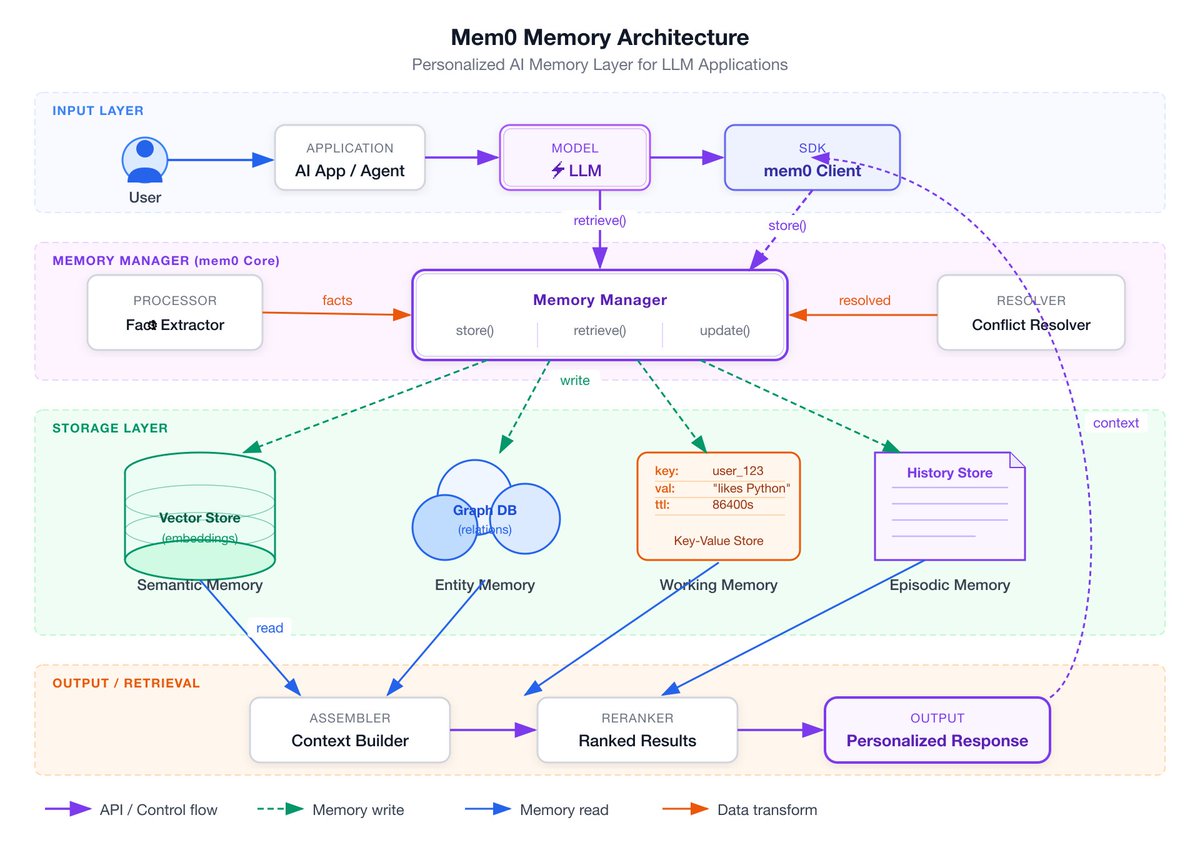
So I made fireworks-tech-graph, a Claude Code Skill that specializes in generating technical diagrams.

o...

Usage is very simple - t "Draw a Multi-Agent collaboration diagram: Orchestrator schedules 3 SubAgents, responsible for search, calculation and code execution, and finally converges to Aggregator to output results, glassy style" Then it will: ① Identify the diagram type → Agent architecture diagram ② Assign semantic shapes → Use hexagons for Orchestrator, hexagons for Agent, and cylinders for storage ③ Code arrows with semantic colors → Blue main process, orange control flow, green reading and writing ④ Automatic export SVG + 1920px PNG The whole process does not require writing a DSL or opening any tools.

Just describe it in one sentence and the picture will appear.

Currently supports 8 graph types and 5 visual styles, and all common patterns in the AI/Agent field are built-in (RAG, Mem0, Agentic Search, Multi-Agent, Tool Call, etc.).

Open source, welcome to star and fork 👇

Visual summary

Article argument map

Generated from the post's content graph

FORMATTOPICCAPABILITYMARKETcoverscoverscoverscoverscoverssignalssignalssignalsFORMATarticle featureTOPICagentsTOPICai workbenchesTOPICtechnical distributionTOPICretrievalTOPICtoolingCAPABILITYagent workflowCAPABILITYAI-native workbenchCAPABILITYtechnical writingMARKETopen-source builders
Mermaid outline
flowchart LR
  format-article["article feature"]
  topic-agents["agents"]
  topic-ai-workbenches["ai workbenches"]
  topic-technical-distribution["technical distribution"]
  topic-retrieval["retrieval"]
  topic-tooling["tooling"]
  capability-agent-workflow["agent workflow"]
  capability-ai-native-workbench["AI-native workbench"]
  capability-technical-writing["technical writing"]
  market-open-source-builders["open-source builders"]
  format-article -->|covers| topic-agents
  format-article -->|covers| topic-ai-workbenches
  format-article -->|covers| topic-technical-distribution
  format-article -->|covers| topic-retrieval
  format-article -->|covers| topic-tooling
  format-article -->|signals| capability-agent-workflow
  format-article -->|signals| capability-ai-native-workbench
  format-article -->|signals| capability-technical-writing

Visual structure

Essay structure map

Built from summary and key paragraph positions

One of the most annoying things about writing technical articles: drawing pictures. T...THESISOne of the mostannoying things aboutwriting technicalarticles: drawingSIGNALOne of the mostannoying things aboutwriting technicalarticles: drawingOPERATORUsage is very simple -t "Draw a Multi-Agentcollaboration diagram:Orchestrator schedulesIMPLICATIONOpen source, welcometo star and fork 👇
Mermaid outline
flowchart LR
  thesis["One of the most annoying things about writing technical articles: drawing pictures. The structure that is v..."]
  signal["One of the most annoying things about writing technical articles: drawing pictures."]
  operator["Usage is very simple - t \"Draw a Multi-Agent collaboration diagram: Orchestrator schedules 3 SubAgents, res..."]
  implication["Open source, welcome to star and fork 👇"]
  thesis -->|frames| signal
  signal -->|develops| operator
  operator -->|lands in| implication

Source: View the original post